
Interest Rates and Your Portfolio: Q4 2026 Market Perspective
October 16, 2026
As Q4 begins, the S&P 500 is on track for its fourth year of double digit returns in a row. And while we’ve had a few spells of stock market volatility this year, it has been bond market returns that have been harder to stomach.
Interest rates and your bond portfolio
Investors started 2026 expecting the Federal Reserve (“Fed”) to reduce interest rates. But in September, the Fed raised interest rates by 0.25%, and projected an additional rate increase later in the year. That shift in interest rate expectations has reverberated across stock, bond, and housing prices, with the greatest impact being felt across bond portfolios.
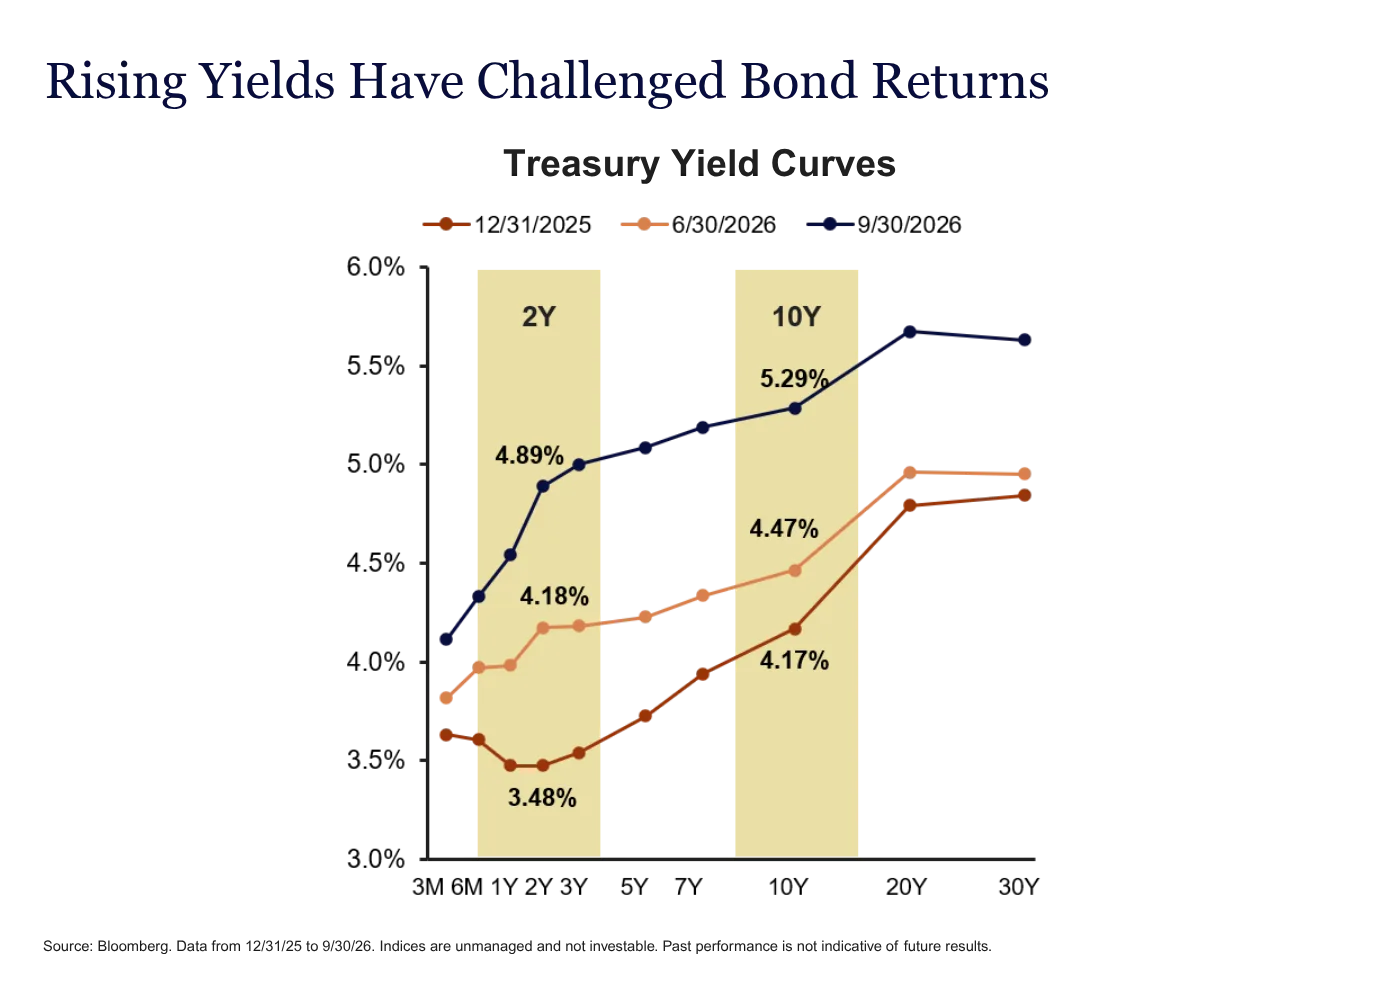
You can see in the chart below just how much interest rates have shifted this year: the 2-year Treasury started the year yielding 3.48% and ended Q3 yielding 4.89%; the 10-year Treasury started 2026 at 4.17% and ended September at 5.29%.
Interest rates have risen meaningfully in 2026
Higher interest rates have pros and cons for bond investors. In the short term, bond prices fall when interest rates rise. However, over the longer term, higher bond yields can drive higher bond market returns.
This trade-off has been particularly evident within the municipal (“muni”) bond market. Munis had their worst quarter in Q3 2026 since 1981, and underperformed the broader bond benchmark: the Bloomberg Municipal Bond Index fell 6.35% in Q3, nearly twice as much as the broader Bloomberg Aggregate Bond Index’s 3.5% decline.
We have intentionally tilted our bond exposure to shorter-dated bonds, preferring the Bloomberg 1-10 Year Municipal Bond Index as a benchmark. This shorter version only fell by 4.1% in Q3. And for investors in the top federal bracket, the Bloomberg 1-10 Year Municipal Bond Index’s tax-equivalent yield is now 7.3% — close to the highest yield available in the last 20 years.
That figure assumes the 40.8% top federal rate and leaves out state taxes, so the benefit is smaller in lower brackets, and higher for investors who live in high-tax states.
Municipal bond yields hit 20-year high 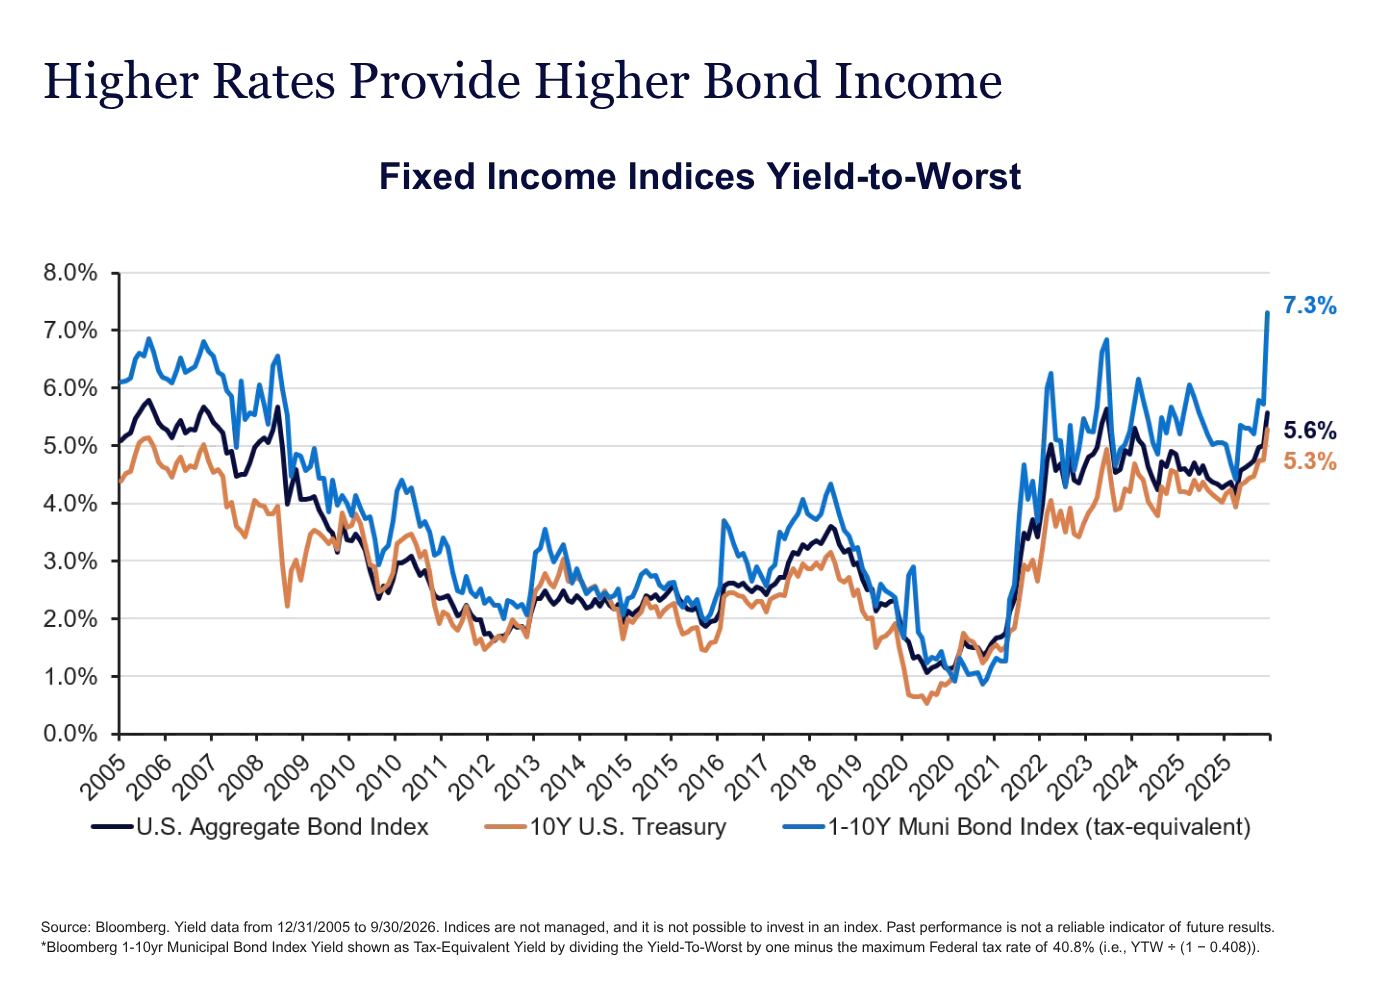
AI and your stock portfolio
Stocks continued their run through Q3. The S&P 500 returned 2.3%, driven mainly by technology stocks, and bringing YTD returns to 12.7%.
Rate-sensitive stocks suffered as interest rates rose, but the big AI names offset their weak performance.
Tech stocks drove the S&P 500 higher in Q3 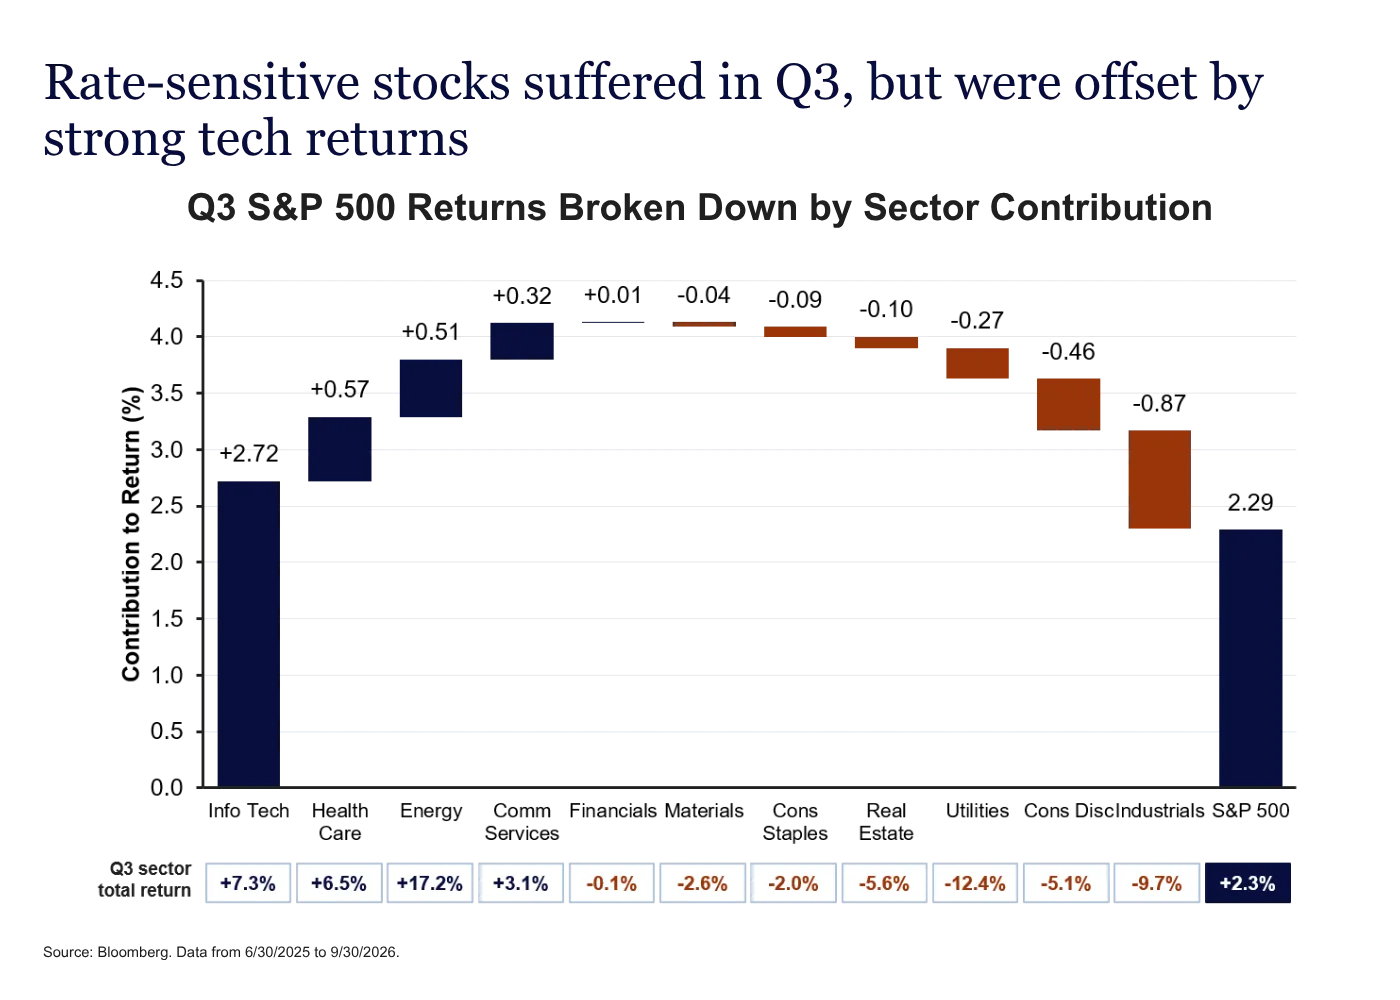 While today’s stock market concentration creates some risk, the rewards to maintaining exposure to the big names driving performance have been significant. Market indexes like the S&P 500 are structured to reflect the publicly traded equity market, assigning the most weight to the companies that have been most successful. Stock weights grow as their earnings and market share grow, and shrink when that reverses. Investors who have chosen to exclude technology stocks have lagged this year: the S&P 500 Ex-Technology Index is only up 3.3% YTD through Q3 vs. the S&P 500’s 12.7%.
It may come as a surprise that, despite rising prices, stocks have actually gotten cheaper this year amid strong earnings growth: the S&P 500’s forward price-to-earnings ratio has fallen from 21x at the start of the year to 19x today. International and emerging market valuations have also fallen.
Stock valuations have gotten cheaper across the globe
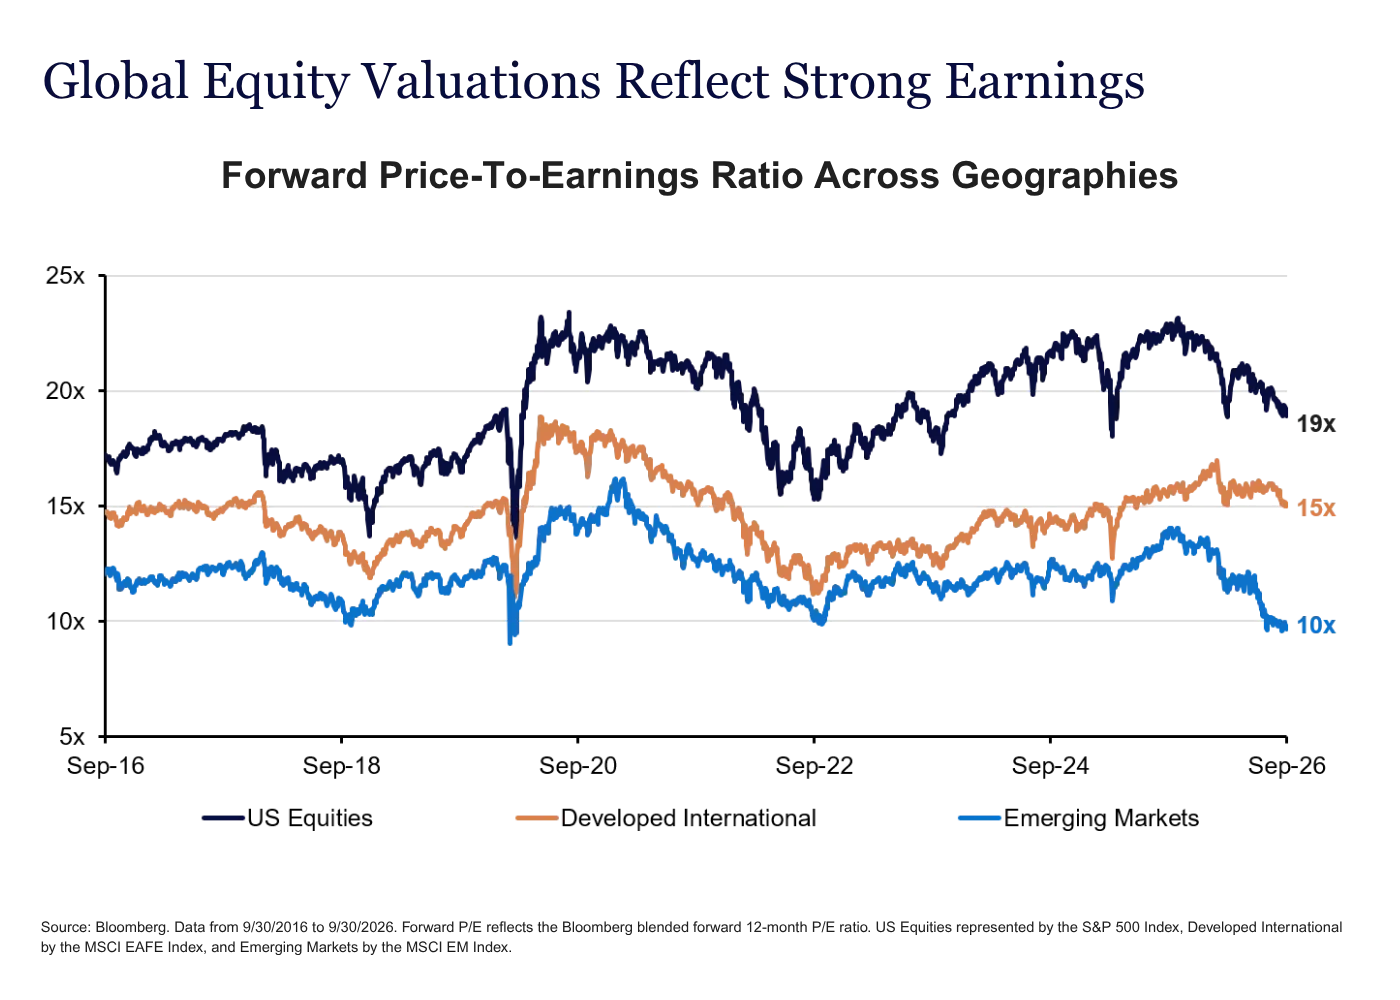 We continue to believe in the importance of including international and emerging market stocks in client portfolios. This exposure helps diversify the U.S.’s concentration risk, while also exposing investors to potentially exciting returns in additional markets. Emerging market stocks, as an example, are the top-performing asset class YTD: the MSCI Emerging Markets Index is up 23.5% through 9/30.
Freestone’s approach to portfolio construction
A year like this is a great reminder of the importance of a disciplined portfolio construction process. Here are three things we’re focused on heading into year-end.
- Staying globally diversified. While we see opportunity in the tech-driven U.S. stock market, we recognize the risk of concentrated leadership as well. As a result, we complement our U.S. stock portfolios with international and emerging market exposures.
- Incorporating munis while managing interest rate exposure. Tax-equivalent yields on municipal bonds have gotten more attractive as interest rates have risen, particularly for investors in the highest tax brackets. We see value here and have also strategically managed our interest rate exposure to avoid the greatest risk.
- Capitalizing on tax-loss harvesting opportunities for taxable clients. The positive side of falling bond prices has been the opportunity to harvest losses for our clients. This allows us to offset gains elsewhere in the portfolio.
- Incorporating alternatives where appropriate. The combination of stock market concentration and interest rate volatility suggests introducing additional forms of diversification. We have seen value in incorporating private real estate and private equity strategies for clients whose liquidity profile makes this suitable.
If you have questions about your own portfolio or financial situation, please reach out to your Freestone advisor.
General Disclosure: For educational and discussion purposes only. Nothing herein is intended to provide, and it should not be relied upon for, accounting, legal, tax or investment advice or recommendations. We are not making any specific recommendations regarding any security or investment strategy, and you should not make any investing decisions based on the information herein. This document contains general information, opinions and market commentary and is only a summary of certain issues and events that we believe might be of interest generally. Opinions are subject to change without notice. While the information presented is believed to be reliable, no representation or warranty is made concerning the accuracy of any information provided, and we do not undertake any responsibility to update such information or advise you of any change in such information in the future. This document speaks only as of the date indicated. Indices referenced in this document are not managed and it is not possible to invest in an index. Past performance of any investment strategy is not a reliable indicator of future results. Links to third-party articles and/or websites are for general information purposes only, are not endorsed by us and you are encouraged to read and evaluate the privacy and security policies on the specific site you are entering.